| ON THE COVER | 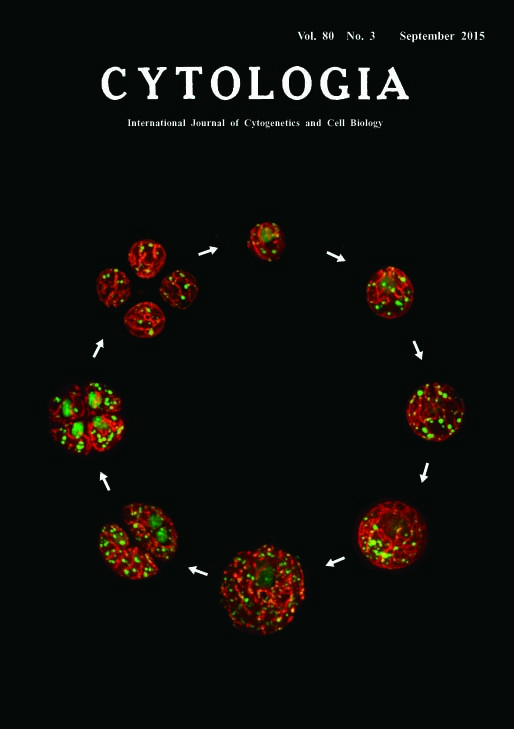 |
|
|---|---|---|
| Vol. 80 No.3 September 2015 | ||
| Technical note | ||
|
|
||
| Live Imaging of Mitochondrial Morphology during Vegetative Cell Cycle in Chlamydomonas reinhardtii
Hiroaki Aoyama1,, Yosikazu Ono2, Tsuneyoshi Kuroiwa3 and Soichi Nakamura4* The unicellular green alga, Chlamydomonas reinhardtii (Chlorophyta), is a model organism that has been studied in terms of motility, photosynthesis, and reproduction, etc., from the viewpoints of molecular and cell biology and ecology. In a previous study, we observed mitochondrial morphological change during vegetative cell cycle by epifluorescence microscopy after staining cells with SYBR Green I or DioC6 dyes (Hiramatsu et al. 2006). The results indicated that mitochondrial morphology dynamically changed during 12-h light/12-h dark cell cycle. On the other hand, details of the relationship between mitochondria and its nucleoids were obscure as mitochondrial and chloroplast nucleoids were not distinguishable. In the present experiment, we observed the morphology of mitochondria and their nucleoids by fluorescent double staining in living cells. Furthermore, we used a confocal fluorescence microscope and constructed a 3D model. We succeeded in visualization of mitochondria (red) and its nucleoids (green) during the vegetative cell cycle (12-h light condition: right side; 12-h dark condition: left side), and showed the localization of mitochondria and its nuceloids in living cells by 3D modeling. Mitochondrial nucleoids appeared as spots of yellowish color in the mitochondria. The mitochondria appeared as tangled sinuous structures that extended throughout the cytoplasm. On the other hand, mitochondrial branches were mostly connected to each other throughout the cell cycle. Additionally, mitochondrial nuceloid numbers increased with the progression of cell division. Living cells were double-stained directly with SYBR Green I and MitoTracker Orange. The final dilution factors of the dye were approximately 1 : 5,000. 4 μL of cell suspension was placed on a glass slide. The cells were observed under two band pass filters (ex: 488 nm, em: 520 nm for SYBR Green I, ex: 561 nm, em: 617 nm for Mito- Tracker Orange) with a Nikon Eclipse Ti-U inverted epifluorescence microscope (Tokyo, Japan) equipped with a Yokogawa laser-scanning unit CSU-X1 (Tokyo, Japan), and a Hama matsu photonics ImagEM C9100-13 electron-multiplying charge-couple device (EM-CCD) camera (Hamamatsu, Japan). Sliced fluorescence images were continuously taken by a Hamamatsu Photonics AQUACOSMOS/RATIO system (Hamamatsu, Japan) at intervals of 0.15 μm/slice in the Z-axis, and exposure time was 0.15 sec/slice. One cell consisted of 50–60 slices. 3D modeling was constructed using NIH image J.
1 Center of Molecular Biosciences, Tropical Biosphere Research Center, University of the Ryukyus, Nishihara, Okinawa 903–0213, 2Graduate School of Engineering and Science, University of the Ryukyus, Nishihara, Okinawa 903–0213, 3Department of Chemical Biological Science, Faculty of Science, Japan Women’s University, Bunkyo-ku, Tokyo 112–8681, 4Laboratory of Cell and Functional Biology, Faculty of Science, University of the Ryukyus, Nishihara, Okinawa 903–0213 *Corresponding author, e-mail: nsoichi@sci.u-ryukyu.ac.jp DOI: 10.1508/cytologia.80.259 |
||