| ON THE COVER | 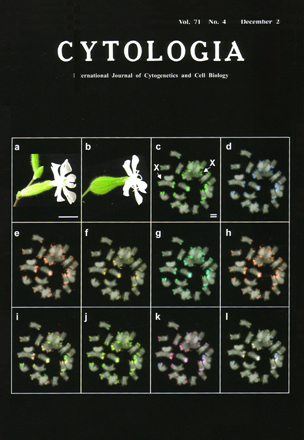 |
|---|---|
| Vol. 71 No4 December 2006 | |
| Technical note | |
|
|
|
| The satellite DNA (satDNA) is a highly repetitive DNA component that is organized in long tandem repeats in the constitutive heterochromatin of eukaryotic genomes. We characterized four subfamilies (SacI, KpnI, #11F02, and #16E07 subfamilies) of the satDNA at chromosomal distal ends in the dioecious plant Silene latifolia (a, male flower; b, female flower). Each subfamily contains slightly different repeat units between them (85% - 95% identity). The figures, c〜1, show multicolored fluorescence in situ hy-bridization (FISH) using the four subfamilies as probes. The probes were prepared by direct labeling with the Alexa Fluor dyes 488, 532, 546 and 647, respectively. Chromosomal DNA was denatured at 75°C for 1 min in 2 ×SSC containing 70% formamide. The chromosome preparations were dehydrated immediately using 5 min treatments with 70% ethanol at -20°C and 100% ethanol at room temperature. The preparations were then treated with acetone for 30 min at room temperature. Each slide was loaded with 8µmicro;l of hybridization mixturc containing 1.25 ng/µl of each of thc four probes, 50% formamide, 10% dextran sulfate, and 2×SSC. The slides were washed at 42°C in 2×SSC containing 50% formamide, and then conterstained with DAPI. The fluorescent images were detected consecutively under a cytogenetic workstation equipped with a black and white CCD camera and processed with an imaging software. The signal pattern of the SacI (c) and KpnI (e) subfamilies coincided with that of the #11F02 (d) and #16E07 (f) subfamilies, respectively. The signal image for each of the probes was merged with every other probe. Merged images of the pairs corresponding to the SacI and #11F02 subfamilies (g) and the KpnI and #16E07 subfamlies (h) showed uniform colors, respectively, This indicates that the distribution and intensity of signals coincide completely. Merged images of the pairs corresponding to c and e (i ), c and f(j), d and e (k), d and f (I) showed various intermediate colors, indicating that the both probes hybridized to different locus in the genome. Our result shows that each chromosomal end has a unique composition of subfamilies of the satDNA. Each subfamily is available for a probe of FISH karyotyping. X, X chromosome. Bar= 1..0 cm (single line) for flowers, 1.0µm (double lines) for FISH images. (see Kazama, Y., Sugiyama, R., Suto, Y., Uchida. W., and Kawano. S,: Genome 49: 520-530, 2006). (Yusuke Kazama1 and Shigeyuki Kawano2,1 Radiation Biology Team, Nishina Cen-ter for Accelerator Based Science, RIKIN, 2-1 Hirosawa, Wako, Saitama 351-0198, Japan. 2Integrated Biosciences, Graduate School of Frontier Sciences, University of Tokyo. Bldg. FSB-601, 5-1-5 Kashiwanoha, Kashiwa. Chiba, 277-8562. Japan) |
|