Masayuki Ikeda, M.D., Takashi Matsunaga, M.D., Noritsugu Irabu, M.D., and Shohji Yoshida, M.D.
Running Title: Vital signs in impaired consciousness
Codirector, Department of Clinical Research (M.I.), National Saigata
Hospital
Director, Department of Neurology ( T.M ) , Asahi General Hospital
Director, Department of Emergency Medicine ( N.I. ), Asahi General
Hospital
Director, Department of Medicine ( S.Y. ), Asahi General Hospital
Correspondence and reprint requests to: Dr. Masayuki Ikeda
Department of Clinical Research, National Saigata Hospital
Ohgata-machi, Nakakubiki-gun, Niigata 949-3193, JAPAN
Phone +81-255-34-3131, Fax +81-255-34-6761
(e-mail: massie@saigata-nh.go.jp)
"Brain lesions often are associated with bradycardia and hypertension.
Ikeda and colleagues conducted an observational and cross-sectional study
on 529 consecutive patients with impaired consciousness and found that
systolic blood pressure has discriminatory power in detecting a brain lesion.
They suggest that a Riva-Rocci sphygmomanometer helps in the diagnosis
of unconsciousness. "
What this paper adds
Systolic blood pressure can distinguish between patients with impaired
consciousness at high and low risk of an organic brain lesion.
General application of systolic blood pressure to the diagnosis of
impaired consciousness helps to avoid wastes of diagnostic modalities and
to identify the cause.
First, hypertension is often observed in patients with acute stroke and in those with increased intracranial pressure [3, 4]. The classic 'Cushing response' [5] (bradycardia with hypertension) is a well-recognised clinical manifestation of increased intracranial pressure. On the other hand, hypotension and tachycardia are the usual findings in states of depressed consciousness that are due to metabolic brain dysfunction, e.g., intoxication, endocrine diseases and sepsis [6].
The continuous scale of the vital signs is relevant to the receiver operating characteristic (ROC) curve [7, 8]. The ROC curves describe the performance of a test by plotting the test's sensitivity against its false-positive rate (1-specificity) at different levels of positivity or negativity [7, 8]. The ROC curve analysis is a preferred method to evaluate screening tests with a continuous scale used to distinguish between subjects with and without the disease.
The aim of our study was to examine the potential value of the
vital signs to distinguish patients with impaired consciousness who are
likely to have an intracranial lesion from those who are not. To this aim,
we plotted ROC curves for the ability of each vital sign to identify patients
with a brain lesion. Cut points were determined by calculating stratum-specific
likelihood ratios (SSLRs) [7] for the different levels
of the vital signs. The SSLRs with their 95% confidence intervals (CIs)
are a useful method of defining strata with high discriminating power.
Statistical analysis
We used the ROC curve [7, 8] to qualify the
diagnostic performance of the vital signs to identify patients with a brain
lesion. The diagnostic accuracy of each vital sign was estimated by calculating
the ROC area under the curve (AUC) and its standard error (ROC AUC ± SE),
by the nonparametric method developed by Hanley and McNeil [10].
Significance of differences between curves was determined as described
by the same authors [10].
SSLR is generally defined as the ratio of two probabilities,
the probability of a given test result when the disease is present, divided
by the probability of the same test result when the disease is absent.
SSLRs were determined by means of the formula: SSLR= (x1/n1)/(x0/n0), where
x1 is the number of subjects with a brain lesion in the stratum, n1 is
the total number of subjects with a brain lesion, x0 is the number of subjects
who are without a brain lesion in the stratum and n0 is the total number
of subjects who are without a brain lesion. The 95% CI was calculated by
the logit method 7. All components of the analysis were performed on a
personal computer with the formulas previously published 7.
Vital signs in patients analysed with ROC and SSLRs
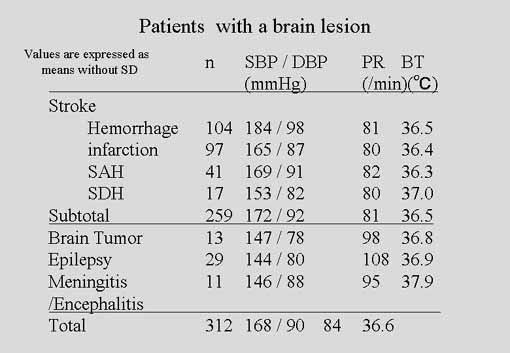
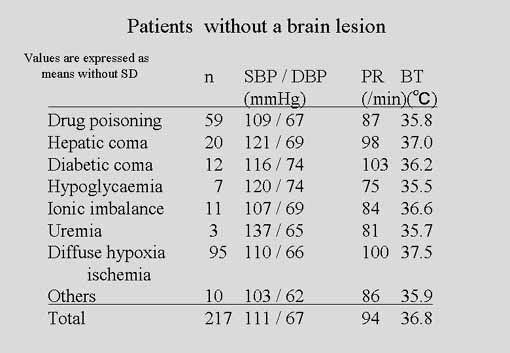
Table 2A and Table2B
show the cause of impaired consciousness and the vital signs of the patients.
Some of the vital signs made a clear distinction between the two groups
classified according to the presence of a brain lesion. The group of 312
(59 %) patients with a brain lesion included 259 (49%) patients with stroke,
29 (5.5 %) with epilepsy, 13 (2.5 %) with a brain tumor and 11 (2.1 %)
with meningitis or encephalitis. 217 (41%) patients without a brain lesion
consisted of 95 (18 %) with diffuse hypoxia or ischaemia, 59 (11 %) with
drug poisoning, 20 (3.8 %) with hepatic encephalopathy, 12 (2.3 %) with
diabetic coma and 11 (2.1 %) with ionic imbalance. Diffuse hypoxia/ischaemia
includes encephalopathy due to hypoxia, hypercapnia or systemic illness
such as sepsis. SBP (168 ± 36 mmHg vs 111 ± 27 mmHg, P < 0.0001) and
DBP ( 90 ± 19 mmHg vs 67 ± 17 mmHg, P < 0.0001) were significantly
higher and PR ( 84 ± 20 /min vs 94 ± 24 /min , P < 0.0001) was significantly
fewer in the patients with a brain lesion than those without one. Body
temperature made no difference.
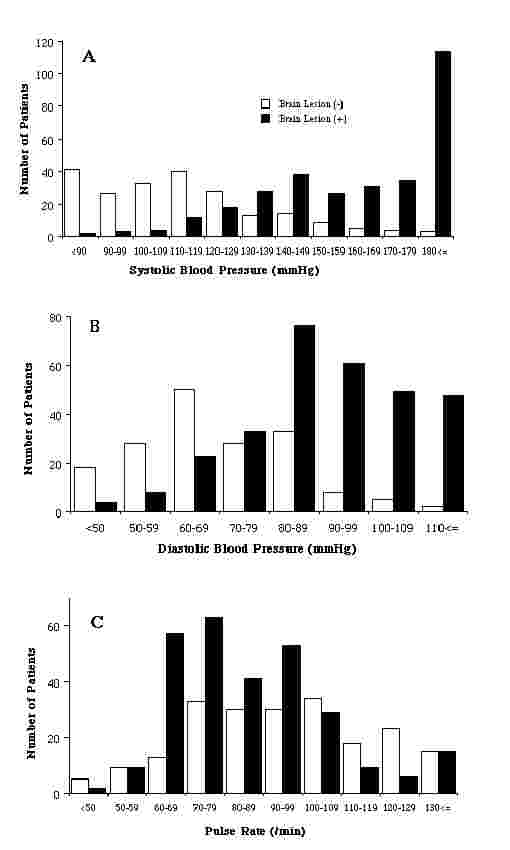
The large variation in the mean of each vital sign, however,
indicates that there is considerable overlap between the two groups (Figure
2). That makes it difficult to apply the information to clinical
practice. A clearer view of the diagnostic significance of the vital signs
can be obtained by determining the sensitivity and specificity of each
level. We calculated these values with a two step-approach, ROC AUC and
SSLR.
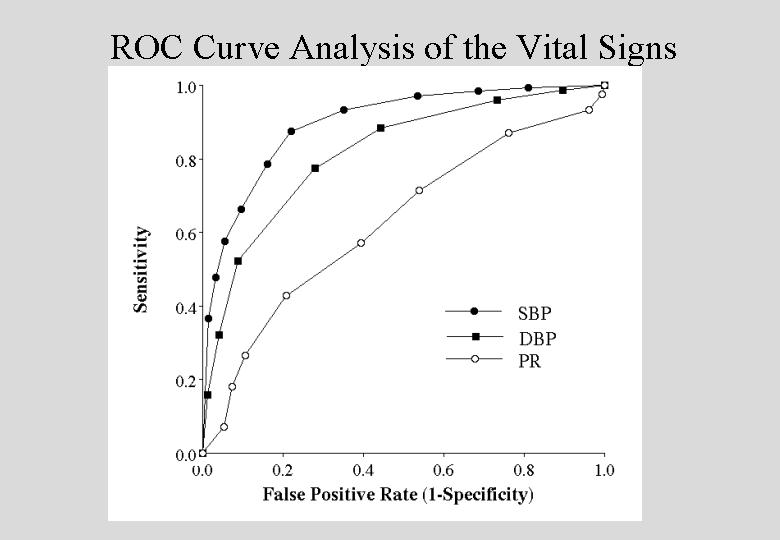
First, we analysed the diagnostic value of SBP, DBP and PR with
ROC AUC ± SE. Figure 3 shows the
ROC curves for each vital sign reported on a continuous scale. The analysis
resulted in a ROC AUC ± SE of 0.90 ± 0.01 for SBP, 0.82 ± 0.02 for DBP
and 0.63 ± 0.03 for PR. The curve for SBP occupies the highest position
in the graph, signifying the best diagnostic performance of the three vital
signs. Accordingly, the ROC AUC was significantly higher for SBP than DBP
(z= 4.53, P< 0.01).
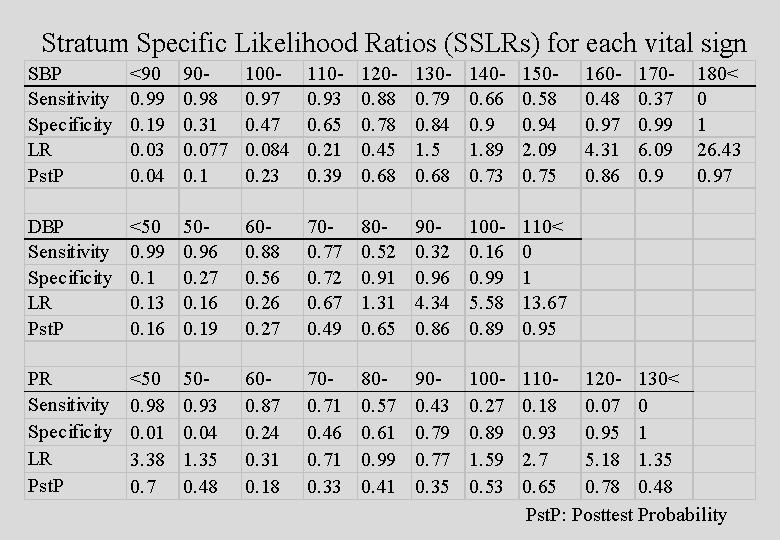
We then calculated SSLRs with their 95% CIs to assess the discriminating
power of the strata used to plot each ROC curve (Table
3). For SBP (Table 3A), which
showed the greatest diagnostic utility as suggested by the ROC analysis,
eleven SSLRs could be identified. With the pretest probability of 0.59
(312 cases with a brain lesion out of total of 529) in our study and Bayes’
theorem, we estimated the post-test probability for each stratum. Eight
SSLRs for DBP (Table 3B) and ten for
PR (Table 3C) were of less diagnostic
value than SBP.
Discussion
Patients with impaired consciousness are divided into two groups,
those with a brain lesion which accounts for the impaired consciousness
and those without [1]. Our study selected SBP
as the best vital sign to discriminate between these two groups. Previous
clinical batteries to determine the nature and site of the lesion impairing
consciousness define the individual criteria [1], [11],
[12]. Their criteria are comprehensive but still too
complex to be evaluated for general practice.
Swets [13] classified the accuracy of ROC
AUC values between 0.5 and 0.7 as low, those between 0.7 and 0.9 as moderate,
and those above 0.9 as high. Judged by their ROC AUC values, the accuracy
of DBP (ROC AUC = 0.82) is moderate and that of SBP (ROC AUC = 0.9), significantly
higher than that of DBP, is marginally high.
Not only the classic Cushing response 5 but also previous studies
on systemic response to impaired autoregulation of cerebral blood flow
(CBF) explain the increase in systemic blood pressure in patients with
impaired consciousness due to a brain lesion. In animal experiments [14],
[15], brain ischaemia results in an increase in systemic
blood pressure. Up to 84% of cases of stroke show an increase in blood
pressure in the acute phase [4]. Yamashiro et al. [3]
suggested that hypertension can identify patients who have a high probability
of stroke as a cause of impaired consciousness. In contrast to hypertension
in patients with an organic brain lesion, hypotension, usually associated
with metabolic brain dysfunction due to drug intoxication, sepsis, diabetic
coma and hepatic encephalopathy [6], should make
SBP a much better measure to discriminate patients with a brain lesion
from those without one.
When CT is available in an emergency department, clinicians liberally
order brain a CT scan for virtually every patient with impaired consciousness.
Nevertheless, about half of patients with impaired consciousness both in
Plum and Posner’s series [1] and ours had no organic
brain lesion. The question we wished to address was whether some of the
patients who are now considered candidates for brain imaging can be classified
as having a low probability of a brain lesion on clinical grounds. Our
study indicates that SBP has discriminatory power for this purpose.
The characteristics of the subjects in our study may make it
subject to certain limitations to generalisation. First, the older mean
age, 65 years, than those in previous studies on patients with impaired
consciousness, 58 years [11] and 54 years [3],
may result from the aged population in our local community. Second, the
incidence of stroke (49%) in our study was higher than those of Plum and
Posner’s (26%: 130 cases out of 500) [1] and Yamashiro
and others (28%: 49 out of 175) [3] but lower than
57 % among British patients with coma [11]. Third,
the high incidence of diffuse hypoxia or ischaemia (18 %) probably reflects
the vulnerability of the older patients in our study to severe systemic
infections, for example, pneumonia, pyelonephritis and cholecystitis. Bates
et al. [11] observed a similar high incidence of diffuse
hypoxia or ischaemia among patients with coma.
In summary, our study confirms the validity of SBP for identifying
patients with impaired consciousness who have a brain lesion and those
who do not. General application of SBP to the diagnosis of impaired consciousness
should result in both clinical and economic benefit. Our study is an important
step toward helping clinicians more effectively manage a common problem.
We encourage other practitioners to validate the accuracy and generalisability
of our results.
Contributors
Masayuki Ikeda designed the study, analysed the data and wrote the
report. Takashi Matsunaga and Noritsugu Irabu did the study and collected
the data. Shohji Yoshida was medical superintendent of the hospital and
allowed us to do our study there. He was also involved in preparation of
both the study and the report. Masayuki Ikeda is guarantor for the study.
Acknowledgments
We gratefully acknowledge the contribution in statistics made by Professor
Toshiaki Furukawa.
11. Bates D, Caronna JJ, Cartlidge N, Knill JR, Levy
DE, Shaw DA, et al. A prospective study of nontraumatic coma: methods and
results in 310 patients. Ann Neurol 1977;2:211-20.
12. Mills ML, Russo LS, Vines FS, Ross BA. High-yield
criteria for urgent cranial computed tomography scans. Ann Emerg Med 1986;15:1167-72.
13. Swets JA. Measuring the accuracy of diagnostic
systems. Science 1988;240:1285-93.
14. Levy LL, Wallace JD. Cerebral blood flow regulation.
II. Vasodilator mechanisms. Stroke 1977;8:189-93.
15. Levy LL, Wallace JD, Stolwijk JA, Poindexter
ER. Cerebral blood flow regulation: vascular resistance adjustments in
the circle of Willis. Stroke 1976;7:147-50.
Figure 2.
Distribution of systolic blood pressure (SBP) (A), diastolic blood
pressure (DBP) (B) and pulse rate (PR) (C) among patients with impaired
consciousness with (open column) or without (closed column) a brain lesion.
SBP (168 ± 36 mmHg vs 111 ± 27 mmHg, P < 0.0001) and DBP ( 90 ± 19
mmHg vs 67 ± 17 mmHg, P < 0.0001) were significantly higher and PR
( 84 ± 20 /min vs 94 ± 24 /min , P < 0.0001) was significantly fewer
in the patients with a brain lesion than those without. There is substantial
overlap, however, in the values for the two groups of patients.
Figure 3.
Receiver operating characteristic area under the curve (ROC AUC) for
systolic blood pressure (SBP), diastolic blood pressure (DBP) and pulse
rate (PR). The curves were plotted with the sensitivity and false-positive
rate ( 1- specificity) at different levels of the measurement as shown
in Table 3.