[-> contents]
[ Document Identification Number : DIN01022805 ]
Digital Color Imaging in Biomedicine (in press), 2001.02.28 (draft)
<http://biocolor.umin.ac.jp/book200102/din01022805.pdf>
Digital Color Imaging in Biomedicine (in press), 2001.02.28 (draft)
<http://biocolor.umin.ac.jp/book200102/din01022805.pdf>
|
Applications of Color Image Processing Based on Spectral Information
Yoichi MIYAKE*1 (miyake@ics.tj.chiba-u.ac.jp) Norimichi TSUMURA*1, Masaru TAKEYA*2, Ryuichi INAGAWA*1 *1Department of Information and Image Sciences, Chiba University *2Department of Genetic Resources I, National Institute of Agrobiological Resources |
|
Abstract: Color is one of the most important points of information about an object. The tri-stimulus values of CIE-XYZ and RGB values obtained by a CCD camera or scanner, however, are dependent on the characteristics of the imaging devices and illuminant conditions. Therefore we have proposed the use of the spectral reflectance of the object for color image processing, transmission and reproduction.
From principal component analysis of gastric mucous membrane and skin color, we have shown that those reflectance spectra can be estimated respectively from the R, G, B signals of electronic endoscopes and a CCD camera. On the other hand, we have also shown that it is necessary to use five channels to estimate the reflectance spectra of oil paintings. We have developed a 5-band CCD camera with 3120H x 2160V pixels and 14 bits for recording the reflection spectra of the paintings and artifacts. The estimated reflection spectra were applied to improve color reproduction and image processing. In this paper, our recent research on the analysis and estimation of spectral reflectance, and some applications are introduced and presented. The first one is measurement of skin absolute spectral-reflectance image and the application to component analysis. Mapping the oxygen saturation of blood and melanin in the skin are expected to provide useful information for skin diagnosis. We have already proposed a technique for estimating the map of skin components from a spectral reflectance image obtained by multiband images based on optical scattering analysis. The spectral reflectance image is a result of dividing the spectral image of the object by the spectral image of an absolute white reference plane. However, the shape of skin is not 2-dimensional. The required absolute spectral reflectance is not obtained in the wide region of the skin by the conventional method. In this research, the absolute spectral reflectance and normal vector of the skin surface are obtained using a photometric stereo technique. In the photometric stereo technique, more than three illuminants are used, and an image is taken by each illuminant. The pixel values in the obtained multiple images are used to calculate the absolute spectral reflectance and normal vector of the surface for the corresponding pixel. An index finger where the second joint was bound by a string was captured and analyzed using the proposed technique. The results show that the components of pigmentation are extracted in the wide range of the finger. The second one is an estimation system for transmittance spectra and its application to an image database system. The transmittance spectra of fungi were estimated from multiband optical micrographs. An optical microscope modified with a single-chip CCD camera with several band filters was used for image acquisition. The Wiener method was applied to estimate the transmittance spectra of two species which belong to one genus of fungi. The Wiener estimation operator was calculated using the transmittance spectra of color samples and the corresponding camera responses. The estimated transmittance spectra were used for reproduction of fungal optical micrographs on three light sources, then a prototype of the illustrated fungi database was developed using the reproduced micrographs. The last one is measurement and analysis of reflectance spectra in the rectal mucous membrane. Using an endoscopic spectrophotometer, 71 reflectance spectra of rectal mucous membrane were measured from 16 patients. The measured reflectance spectra were analyzed by principal component analysis. The analysis shows that the reflectance spectra can be adequately represented by three principal components. On the basis of this experimental result, the reflectance spectra of each pixel in the rectal mucous membrane images taken by electronic endoscopes were estimated from RGB signals using three eigenvectors calculated by principal component analysis. The Wiener estimation method was also introduced to estimate the reflection spectra. Color reproduction of electronic endoscopes with different illuminants was estimated and analyzed by computer simulation. |
|
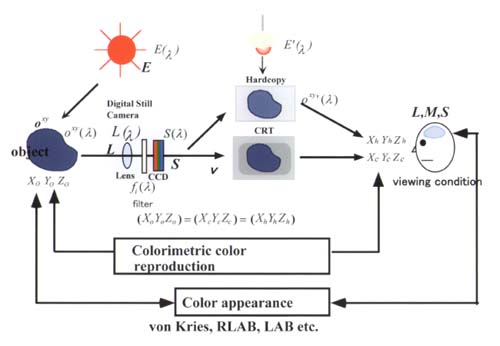
A. An Outline of Color Image Processing Based on Spectral Information A-1. Introduction In recent years, there has been an increasing requirement to develop digital imaging systems with high quality in printing, artworks, telemedicine and internet shopping instead of using silver halide photography. In silver halide photography, it is possible to acquire, record and display the image using only one material and it can take and record pictures easily without energy. Silver halide photography also has high quality therefore, it has been widely used as recording material for a long time. However, in photographic systems, the quality of the image such as color and tone reproduction characteristics is dependent on the development and imaging conditions of the object. Then in the digitization of the photographic image, scanner characteristics largely influence the image quality, particularly color reproduction characteristics. Furthermore, photographic film cannot record the spectral reflectance of the object since it uses only three R, G, B sensitive materials [1,2]. Therefore, it is necessary to record and reproduce the device-independent color of paintings or 3D objects. For exact color reproduction of paintings, we have developed a high-quality multiband camera as is shown later. Figure 1 shows the color reproduction systems of the object with reflection spectra Oxy(λ), where (x, y) is coordinate of the object and λ is wavelength from 400nm to 700nm. |
 |
|
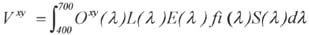
The camera response vixy (i=1,2,--) can be represented as
|
 |
(1) |
|
where, E(λ) is the spectral radiant distribution of the imaging illuminant and L(λ) is the spectral transmittance of optical systems.
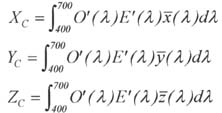
In this equation, the spectral sensitivity of sensor Si (λ) is represented by S(λ)fi (λ), where fi (λ) is the spectral transmittance of the filter. In conventional imaging systems, i equals 3, namely i=R, G, B. In other words, vixy is recorded into memory and then displayed onto a CRT monitor or printed onto paper after some image processing. With color film, the amount of cyan, magenta, and yellow dyes in the sensitive emulsion can be related to the VR, VG, VB, then the spectral reflectance of the image O'xy(λ) is determined by the subtractive mixture of the c, m, y dyes. On the other hand, the spectral luminance of the CRT image O'xy(λ) is determined by the additive color mixture of the R, G, B phosphors. Then, colorimetric color reproduction, which is characterized by the tri-stimulus values XoYoZo of the original and XcYcZc of the reproduced image have the same values, has been widely used for color reproduction. The tri-stimulus values XcYcZc of the image can be calculated as |
 |
(2) |
|
where O'xy(λ) is the spectral reflectance of the image, E(λ) is the spectral radiant distribution of the viewing illuminant and x(λ) y(λ) z(λ) is the color matching function. It is clear that the tri-stimulus value is dependent on the imaging and viewing illuminants, and on the spectral characteristics of the imaging systems. Therefore, we proposed to record the spectral reflectance of the object, which is a specific characteristic of the object.
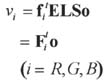
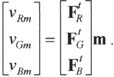
A-2. Principal component analysis of spectral reflectance of the object We measured about 1,000 reflectance spectra of gastric mucous membrane using a developed endoscopic spectrophotometer [3]. We also measured about 4,000 reflectance spectra of color charts, 148 oil paintings, several 100 skin colors of Japanese women and 71 rectal mucous membranes. These measured reflectance spectra were analyzed by principal component analysis. The results for skin color [4] and mucous membrane [5] showed that the contribution ratio from first to third components is about 99%; in other words, the reflectance spectra of the skin and mucous membrane can be represented approximately 99% of the time using a linear combination of three principal components u1, u2 and u3. However, in oil paintings, it was found that five components were necessary to reproduce the spectra. Although the spectral characteristics of the systems are inherently continuous, for the convenience the discrete vector notation is introduced as E(λ):E, トR(λ), トG(λ), トB(λ):fi(i=R,G,B), L(λ):L, S(λ):S, o(λ):O. Then the R, G and B values of an object that are obtained by an imaging system are expressed as |
 |
(3) |
|
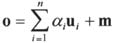
where Fit(i=R,G,B) is the overall spectral sensitivity of the imaging system, and [・]t represents transposition. Because orthonormal vectors with n-dimensional space were obtained by the principal component analysis, the reflectance spectra of the object o can be calculated by
|
 |
(4) |
|
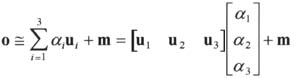
where αi is an expansion coefficient and m is the mean vector of the measured reflectance spectra. From the result of principal component analysis of the skin and mucous membrane, o can be approximated by the linear combination of the three eigenvectors u1, u2 and u3 with the mean vector m.
|
 |
(5) |
|
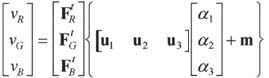
From Eqs. (3) and (5)
|
 |
(6) |
|
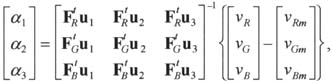
Then, the constant value α1, α2 and α3 is given by
|
 |
(7) |
|
where,
|
 |
(8) |
|
Because ui(i=1,2,3) and m are known and Fit(i=R,G,B), vi(i=R,G,B) and vim(i=R,G,B) are obtained from general imaging systems, the coefficients α1, α2 and α3 can be calculated by Eq.(7).
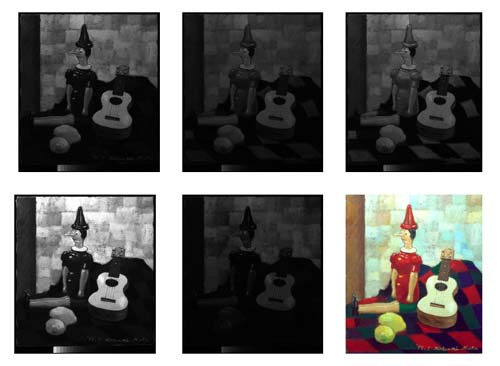
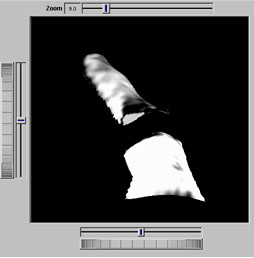
The reflectance spectra of the object can be estimated by Eq. (5); therefore it becomes possible to calculate the reflectance spectra of all pixels Oxy(λ) from the R, G, B output signals obtained by a general imaging system. A-3. Applications of multispectral imaging A-3.1 Development of multispectral imaging systems We have developed multispectral imaging systems for digital archives and a network museum.(1),(2) This system consists of a single-chip high-quality CCD camera (3120 x 2060 pixels, 14 bit levels) with a rotating color wheel comprising eight color filters (in the experiment five filters were used), a high-quality CRT monitor and video projector, and personal computer. The system is controlled by three software; Image Digitizer, Image Estimator and Image Reproducer. Image Digitizer controls the rotating of the filters, the focusing of the lens, the viewing angle and exposure. After taking an image, gamma correction, noise reduction and compensation of pixel defects of the CCD camera are also processed by Image Digitizer. Image Estimator does estimation of the reflectance spectra of the object based on principal component analysis and Wiener estimation from 5-band images. Image Reproducer is software that reproduces the color image from the estimated reflectance spectra of the object. Figure 2 shows 5-band images taken by this camera and those synthesized images. |
 |
|
A-3.2 Computer simulation of color reproduction and optimization of imaging illuminants in endoscopes
As mentioned above, when we could estimate the reflectance spectra of the object Oxy(λ), then the color reproduction of images taken by different kinds of illuminants and the spectral characteristics of the imaging systems could be estimated by computer simulation. We applied the method to optimize the imaging illuminant and the spectral sensitivity of the electronic endoscopes. The spectral information was also applied to estimate the color appearance of facial patterns and estimation of preferred color reproduction of facial patterns. Additionally, we have studied the separation of melanin and hemoglobin by independent component analysis [6] and the estimation of maps of melanin, oxy-hemoglobin and de-oxy-hemoglobin in the skin based on the reflectance spectra of the image using the inverse optical scattering technique. In the optimization of the imaging illuminants of electronic endoscopes, color reproduction of the electronic endoscope images taken by 18 kinds of illuminants was estimated by computer simulation. These simulated images include cancer, early stage of chronic gastritis, chronic gastritis, advanced stage of chronic gastritis, gastric ulcer; and physicians who were endoscopy diagnosis specialists evaluated the images. As a result, a xenon lamp was selected as the most preferred illuminant. On the other hand, the POCS (Projection Onto Convex Set) method was also applied to design the optimum spectral radiant distribution of optical endoscopes [7]. POCS is an iterative algorithm to obtain a solution, which holds simultaneously under certain predetermined conditions. Each condition must be defined so that its solution space forms a convex set. Therefore, the solution is obtained by repeating the projections onto each subspace. These conditions were obtained by the reflectance spectra of the gastric mucous membrane. A-3.3 Color reproduction based on color appearance model The tri-stimulus value XYZ of the object under a selected illuminant was calculated from the estimated spectral reflectance Oxy(λ). Then color adaptation models were introduced for color correction [8]. In the Fairchild model, the cone fundamental values after adaptation L',M',S' can be expressed by |
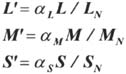 |
(9) |
|
where L, M, S are cone fundamentals before adaptation, LN, MN, SN are cone fundamental responses for the white point, αL, αM, αS are incomplete adaptation coefficients. From L',M',S', we can calculate the tri-stimulus value XYZ of the image after adaptation. This method was applied to estimate color reproduction of facial patterns and oil paintings.
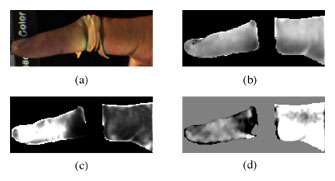
A-3.4 Applications to segmentation of the object Transmittance spectra of fungi were estimated by 7-band optical micrographs using the Wiener estimation method [9]. The estimated transmittance spectra of fungi in each pixel were used as input vectors to the artificial neural network for the segmentation of the fungal micrographs. This showed the significance of a multiband imaging system by comparison between RGB and multispectral imaging systems. A-3.5 Estimation of reflection spectra of 3D object based on dichromatic and Phong models For exact color reproduction of oil paintings, we have developed the high-quality multispectral camera shown in section 3.1. The gonio-spectral imaging method was introduced to record the reflectance spectra of the surface of a 3D object using a developed 5-band CCD camera [10]. Five-band images were taken with seven different illuminant angles (45, 60, 75, and 90, 105, 120, 135 degrees). A dichromatic model was introduced for separation of the body reflection and specula reflection of the 3D object from those obtained 5-band images. A Phong model was also introduced to represent the continuous gonio-photometric information from the 5-band images taken by seven illuminant angles. The results show that our proposed method is able to reproduce the color and glossiness of the 3D object. A-4. Conclusions In this paper, we introduced our recent studies on multispectral imaging. We have developed a multispectral imaging system with highly accurate quality. The system was significantly applied for recording oil paintings. A gonio-photometric imaging method with dichromatic and Phong models were also introduced to reproduce the color and glossiness of the 3D object. Furthermore, we have shown that the reflectance spectra of the skin and membrane can be estimated from 3-channel signals based on principal component analysis. Several applications such as optimization of imaging illuminants of endoscopes, color appearance modeling and computer simulation of color reproduction using reflectance spectra were presented and described. Spectral reflectance is an inherent value of the object and is a highly device independent value. Therefore, we consider that it should be used for the transmission, recording and reproduction of images such as for an Internet museum, network shopping and tele-medicine in the future. Reflectance spectra include significant information about the object, therefore we believe that they will offer some new possibilities for research on the diagnosis of skin and membrane disorders, and also for cosmetic sciences. B. Measurement of Skin Absolute Spectral-Reflectance Image and Application to Component Analysis B-1. Introduction Mapping the oxygen saturation of blood and melanin in the skin are expected to give useful information for skin diagnosis. We have already proposed a technique for estimating the map of skin components from the spectral reflectance image obtained by multiband images based on optical scattering analysis [11,12]. The spectral reflectance image is a result of dividing the spectral image of the object by the spectral image of the absolute white reference plane. However, the shape of the skin is not a 2-dimensional plane. The required absolute spectral reflectance is not obtained in the wide region of the skin by conventional methods. In the region where the normal vectors of the reference white plane and the skin are different from each other, the obtained spectral reflectance is a relative spectral reflectance that is the multiplication of the absolute spectral reflectance multiplied and constant value. In recent remarkable developments of computer performance, image based rendering is becoming notable throughout the world. Image based rendering is a technique that extracts the 3-D, color and texture information by using computer vision techniques, and displays the captured information of image in an arbitrary point of view with an arbitrary illuminant using computer graphics techniques. B-2. Methods and results In this research, the absolute spectral reflectance and normal vector of the skin surface are obtained using a photometric stereo technique. The extracted shape information and result of component analysis are displayed in an arbitrary point of view with arbitrary illumination using computer graphics techniques. Photometric stereo is one of the popular computer vision techniques. In the photometric stereo technique, more than three illuminants are used, and an image is taken by each illuminant. The pixel values in the obtained multiple images are used to calculate the absolute spectral reflectance and normal vector of the surface on the corresponding pixel. The characteristic of Lambertian in the skin surface reflectance is assumed in the calculation. An index finger where the second joint was bound by a string was captured and analyzed using the proposed technique. In this experiment, four directions of illumination were used for photometric stereo. Figure 3 shows the result of component analysis for the index finger where the second joint was bound by a string. Figure 3 (a) shows the original image, (b) melanin component, (c) total hemoglobin, and (d) oxygen saturation. The results show that the components of pigmentation were well extracted in the wide range of the finger. Figure 4 shows the distribution of oxygen saturation in different points of view from the originally taken image. The change of view point is simulated by a computer graphics technique from the estimated shape information of the skin. In this demonstration, both the shape and component are observed at the same time. |
|
|
 |
 |
|
B-3. Conclusions
It is necessary to consider complex reflections such as secular reflection on rough skin surface. This research, however, has shown the effectiveness of using computer vision techniques for medical image measurement, and the possibility of a novel medical imaging system that will be applicable for a tele-medicine system by combining computer vision and computer graphics techniques. C. Development of an Estimation System for Transmittance Spectra and Application to an Image Database System C-1. Introduction Gene banks preserve and manage a lot of genetic resources related to agriculture worldwide [13]. One of the most important activities in a gene bank is the development of an efficient method to transmit genetic resource information to users. Recently, morphological characteristics can be transmitted as image data through the Internet. The shape and color of fungi are especially varied, therefore it is useful that fungal micrographs are stored in an image database and the image information is accessible by users. Thus, the development of the fungi image database system was promoted. In this study, transmittance spectra were used as image data, because they are not influenced by the spectral characteristics of the imaging system and light source. Optical micrographs under an arbitrary light source can be reproduced using the spectral transmittance of each pixel. In the case of a microspectroscope, adequate performance cannot be obtained due to the functional limit of diameter and time of measurement. Therefore, in this study, the spatial distributions of the transmittance spectra in the optical micrographs were estimated from multiband images taken by a multiband imaging system. C-2. Estimation system of transmittance spectra of optical micrographs In the proposed multiband imaging system, the multiband image of the optical micrograph is taken using a CCD camera attached to an optical microscope. During the experiment, several broadband filters were used to take the multiband image, and each filter was inserted in turn between the condenser lens and the light source. Wiener's estimation method is used to estimate the transmittance spectra of objects [10,14,15]. Using vector-matrix notation, camera responses v at one pixel can be expressed as |
 |
(10) |
|
where v denotes a column vector with m (the number of filters) elements, and o denotes a column vector with l (the number of sampling) elements, representing the spectral transmittance of the object. These two vectors are related by a linear system matrix F with m x l components.
The estimated spectral transmittance oest is given by the following linear operation of the Wiener method, |
 |
(11) |
|
The matrix G is determined to minimize the ensemble average of square error S between the original and the estimated transmittance spectra,
|
 |
(12) |
|
Here < > represents the ensemble average. The matrix G is explicitly expressed as
|
 |
(13) |
|
where Rov and Rvv denote the correlation matrices defined as
|
 |
(14) |
|
The estimated transmittance spectra can be obtained through the calibration phase and estimation phase as follows.
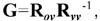
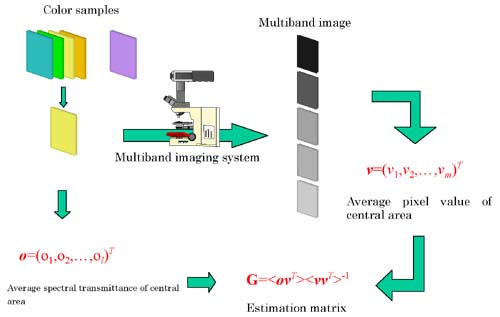
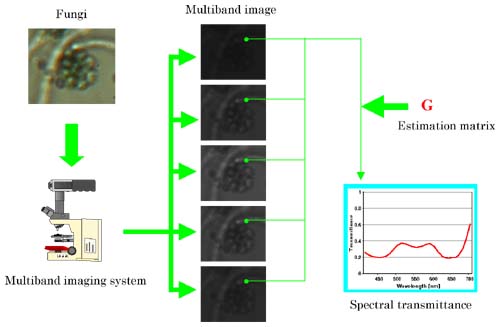
Calibration phase (Fig. 5): Average spectral transmittance of the central area of the color sample is expressed as o. Next, the color sample is taken by the imaging system, and the average camera response set of the central area of the multiband image is expressed as v. Rov and Rvv are calculated from o and v, then the matrix G is derived. Estimation phase (Fig. 6): A multiband image of object is taken by the imaging system, and the camera response set on same pixel of the multiband image multiplied by G is the estimated spectral transmittance at this pixel. This process is applied to estimate the spectral transmittance of all pixels. Accordingly, a transmittance-spectra image with the spectral transmittance of each pixel can be obtained. |
 |
 |
|
C-3. Production of image database using spectral images
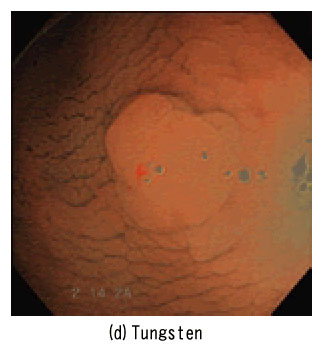
In this study, two kinds of fungi belonging to genus Trichoderma were estimated using the proposed estimation system. Then, a prototype of the fungi image database was developed using the reproduced images. Image database systems for plants and animals have already been developed in our gene bank, and their image information has been transmitted over the Internet. The developed prototype was introduced for the first microorganism image database. Image data is linked to other data sets of the genetic resources database through key descriptors. An outline of the database system is shown as follows 1) On the web page of the image database, a target fungus can be selected from fungal concordance. (Fig. 7(a)) 2) The web page of the selected fungus is shown as in Fig. 7(b). The web page has micrographs of strains belonging to the fungus and links to the following three pages. 3) Reproduced micrographs with three light sources, CIE D65, halogen lamp, and tungsten lamp, are shown as in Fig. 7(c), owing to recurrence of a view of an optical microscope that researchers usually use. 4) By clicking some pixels in the micrograph of Fig. 7(b), the corresponding spectral transmittance is shown as in Fig. 7(d). 5) Accession numbers of the preserved target fungus in the gene bank are shown in the bottom of Fig. 7(b). By clicking on the accession number, the corresponding passport data such as source, year of isolation, and strain number are selected from microorganism genetic resource database and shown as in Fig. 7(e). |
 |
|
C-4. Conclusions
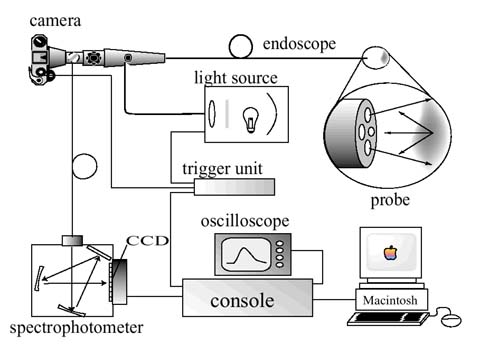
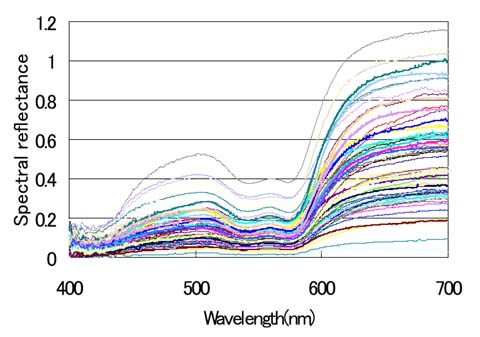
This study shows that the transmittance spectra of all pixels can be estimated at a time, which is not possible using former microspectroscopes, by our proposed system using multiband imaging. Micrographs were reproduced from the spectral radiance of three kinds of light sources and estimated transmittance spectra. The prototype of the fungi image database was developed using the reproduced micrographs. To be able to use the database system in the gene bank on a practical basis, our next research subjects will be the development of a maneuverable system to acquire and input spectral data and the structure of the image database with a lot of registered spectral data. D. Measurement and analysis of reflectance spectra in rectal mucous membrane D-1. Introduction Color images taken by electronic endoscopes provide important information for diagnosing various kinds of rectal and stomach diseases. The color reproduction of electronic endoscopes, however, is not good enough to diagnose the early stage of the disease. Therefore, improvements in the color reproduction of electronic endoscopes have been required. In a previous paper [16], computer simulation was introduced to estimate the reflectance spectra and applied to improve the color reproduction of stomach mucous membrane based on principal component analysis. In this paper, a similar method was introduced to improve color reproduction of rectal membrane. For this purpose, we first measured the reflectance spectra of the intestinal mucous membrane using an endoscopic spectrophotometer [17]. At Kyoto National Hospital 71 reflectance spectra of rectal mucous membrane were measured and the obtained data were analyzed by principal component analysis. The results showed that the reflectance spectra of rectal mucous membrane can be expressed as a linear combination of three eigenvectors obtained by principal component analysis. The Wiener estimation method was also applied to estimate the reflection spectra of the rectal membrane. The present paper discusses the measurement of the spectral reflectance of the rectal membrane, principal component analysis of those measured spectra, estimation of the reflection spectra by the Wiener estimation method and computer simulation of the color reproduction of electronic endoscopes. D-2. Measurement of reflectance spectra of rectal mucous membrane Figure 8 shows a schematic diagram of the endoscopic spectrophotometer used in our experiments. The surface of the rectal membrane is illuminated by a xenon lamp through the light guide, and the reflected image is formed in the entrance aperture of the spectrophotometer. The spectral light is analyzed by an optical multichannel analyzer with 1024 diode-array detectors. We measured 71 reflectance spectra of normal rectal membrane from 16 patients at Kyoto National Hospital. Figure 9 shows the measured reflectance spectra after noise reduction processing and calibration using a standard white plate. It is clear that these spectra are strongly absorbed from 20 nm to 600 nm by the spectral characteristics of hemoglobin. These reflection spectra were analyzed by principal component analysis. Figure 10 shows the cumulative contribution ratio of three principal components; namely this result describes that 99.7% of the reflection spectra of rectal membrane can be expressed by only three principal components. |
 |
 |
 |
|
D-3. Color reproduction simulator for electronic endoscopes
The color reproduction characteristics of electronic endoscopes are dependent on many factors such as the spectral radiant distribution of the illuminant;E(λ), the spectral sensitivity of the CCD;S(λ) , the spectral transmittance of the filters;トi(λ) i=r,g,b, and the spectral transmittance of imaging lenses; L(λ). Then the output signal Vi(x,y) i=r,g,b can be calculated as |
 |
(15) |
|
where, O(λ,x,y) is the spectral reflectance of the mucous membrane and (x,y) is the coordinates of the object. From principal component analysis and the Wiener estimation method, the reflectance spectra of the object O(λ,x,y) can be estimated; then we can calculate the output image with different illuminants, CCD sensitivities and filter characteristics.
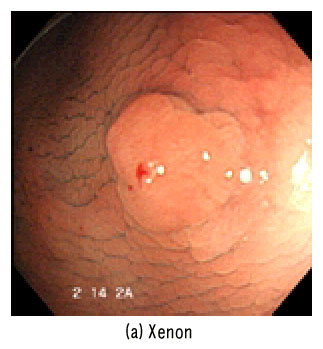
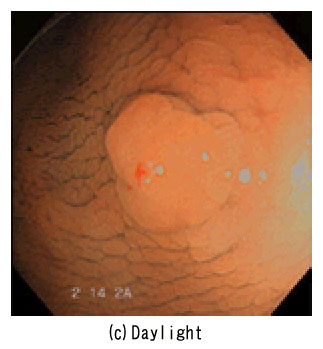
In the Wiener estimation, we first measure the R,G,B digital values (in the Eq. (15), R, G, B are correspond to Vi) of Macbeth Color Checkerョ using an electronic endoscope. Secondly, we measure the precise reflectance spectra of each color patch with a spectrophotometer. Using these two data sets, we can calculate a system matrix to estimate the spectral reflectance of the object by the Wiener estimation method. Figure 11 shows examples of simulated images under various illuminants; Xenon, D65, Daylight and Tungsten lamp. Physicians can compare the color reproduction to each image calculated under various illuminants and they can estimate the optimal illuminant for diagnosis without need for practical experiments. |
    |
|
D-4. Conclusions
We have measured 71 reflectance spectra of normal rectal mucous membrane using an endoscopic spectrophotometer. The reflection spectra of rectal mucous membrane were estimated by the PCA and Wiener estimation methods based on analysis of those measured reflectance spectra. The color reproduction of electronic endoscopes using various illuminants was estimated by computer simulation. Acknowledgments We appreciate the helpful advice of Prof. M. A. Kriss, Prof. K. A. Parker and Prof. K. Kutulacos, University of Rochester, and are most grateful to the following co-researchers; Prof. Francisco H. Imai, Rochester Institute of Technology, Prof. H. Haneishi, Chiba University, H. Satake, MD, Kyoto National Hospital, and T. Hara, Olympus Optical Co., Ltd. References
|